
December 2021 Issue
Research Highlights
Sleep science
Frequency analysis helps to understand sleep disorder
Sleep apnea syndrome (SAS) is a sleep disorder characterized by the occurrence of pauses in breathing (apnea) during sleep. Such pauses can typically last for more than 10 seconds and are often followed by loud snoring. The brain interprets each breathing pause as danger — because of the decrease in oxygen supply — and sleep becomes shallow. As a result, a person suffering from SAS builds up a sleep debt, which may in turn lead to mental health issues like depression or dementia. In order to avoid medical complications, early detection of SAS is crucial. So-called non-contact detection methods are based on monitoring chest motion, e.g. by means of a sensor attached to the mattress sensor the person is sleeping on; from the recorded bio-vibration data, breathing frequencies and amplitudes can be derived. This type of method is not always effective. For example, when a person’s breathing is ‘forced’ (breathing accompanied by thoracic and abdomen movement, and in fact also a symptom of SAS), sleep apnea is difficult to detect. Now, Iko Nakari and Keiki Takadama from the University of Electro-Communications have developed a new method for processing overnight bio-vibration data that can detect SAS in a more universal way.
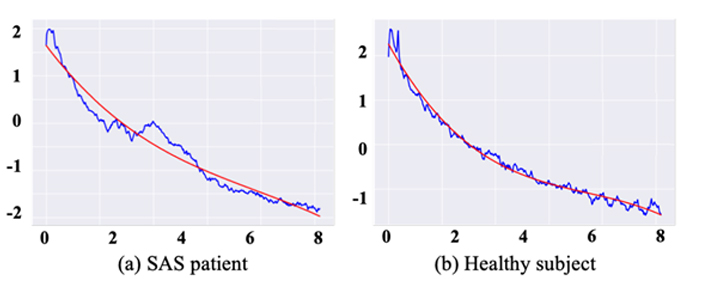
The researchers analysed bio-vibration data recorded from 9 SAS patients and 9 healthy individuals, obtained by means of a mattress sensor. Rather than looking only at respiration (between 0.1 Hz and 0.2 Hz) and heartbeat (between 0.6 Hz and 1.5 Hz) frequencies, they considered frequencies up to 8 Hz, and looked at the distribution — the spectrum — of frequencies. When comparing frequency spectra, Nakari and Takadama noticed a slight increase in frequency density around 3 Hz for the SAS patients. On a logarithmic plot of the frequency spectrum, this increase manifests itself as a convex shape. Based on this observation, the researchers defined a quantity called the degree of convexity of the logarithmic spectrum (DCLS).
Remarkably, the average DCLS value for the SAS patients (≈ 99 ± 10) is completely separate from the average value for the healthy subjects (≈ 48 ± 7). Therefore, the DCLS value has the potential to be used as an indicator for SAS — obtained just by sleeping on a mattress sensor.
Further analysis showed that the increased frequency density around 3 Hz corresponds to accumulated density in the so-called WAKE stage (the first of six levels used for characterizing ‘sleep deepness’). Therefore, it is likely that the WAKE stage is different for SAS patients and people not suffering from sleep apnea. Even more, the researchers argue that SAS subjects generate 3 Hz waves during WAKE phases, and believe that this may actually be a hitherto unknown symptom of SAS, apart from the apnea itself. However, as Nakari and Takadama point out, future work “should clarify the phenomenon around 3 Hz”.
References
